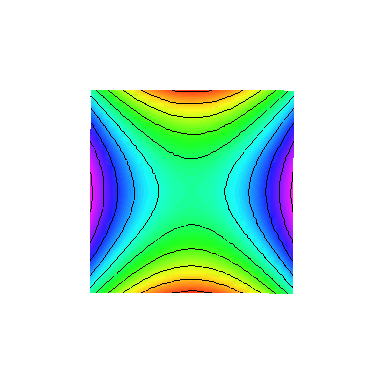
| > | with(plots):
pic := n-> [plot3d(x^2-y^2, x=-5..5, y=-5..5, contours=10, orientation=[5*n/4,n], grid=[30,30], style=patchcontour, shading=ZHUE)]: display(seq(pic(n),n=0..60), insequence=true); |
|
This is an animated contour plot (in Maple) of the function f(x,y)=x^2-y^2 using code borrowed from
Barbara K. D"Ambrosia and Carl R. Spitznagel. The graph z=f(x,y) is a classic example of a saddle surface.
The shading color varies by the height and shows both the symmetry and saddle nature of the graph.