Three-dimensional pie chart
Syntax
pie3(X)
pie3(X,explode)
h = pie3(...)
Description
pie3(X)
draws a three-dimensional pie chart using the data in X. Each element in X is represented as a slice in the pie chart.
pie3(X,explode)
specifies whether to offset a slice from the center of the pie chart. X(i,j) is offset from the center of the pie chart if explode(i,j) is nonzero. explode must be the same size as X.
h = pie(...)
returns a vector of handles to Patch, Surface, and Text graphics objects.
Remarks
The values in X are normalized via X/sum(X) to determine the area of each slice of the pie. If sum(X)
1, the values in X directly specify the area of the pie slices. MATLAB draws only a partial pie if sum(X)<1.
Examples
A slice in the pie chart is offset by setting the corresponding explode element to 1:
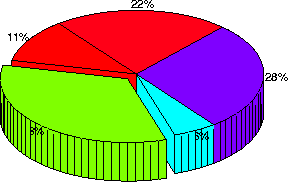
x = [1 3 0.5 2.5 2]
explode = [0 1 0 0 0]
pie3(x,explode)
colormap hsv
See Also
pie
[ Previous | Help Desk | Next ]