Create and control multiple Axes
Syntax
subplot(m,n,p)
subplot(h)
subplot('Position',[left bottom width height])
h = subplot(...)
Description
subplot divides the current Figure into rectangular panes that are numbered row-wise. Each pane contains an Axes. Subsequent plots are output to the current pane.
subplot(m,n,p)
creates an Axes in the p-th pane of a Figure divided into an m-by-n matrix of rectangular panes. The new Axes becomes the current Axes.
subplot(h)
makes the Axes with handle h current for subsequent plotting commands.
subplot('Position',[left bottom width height])
creates an Axes at the position specified by a four-element vector. left, bottom, width, and height are in normalized coordinates in the range from 0.0 to 1.0.
h = subplot(...)
returns the handle to the new Axes.
Remarks
If a subplot specification causes a new Axes to overlap an existing Axes, subplot deletes the existing Axes. subplot(1,1,1) or clf deletes all Axes objects and returns to the default subplot(1,1,1) configuration.
You can omit the parentheses and specify subplot as:
subplot mnp
where m refers to the row, n refers to the column, and p specifies the pane.
Special Case - subplot(111)
The command subplot(111) is not identical in behavior to subplot(1,1,1) and exists only for compatibility with previous releases. This syntax does not immediately create an Axes, but instead sets up the Figure so that the next graphics command executes a clf reset (deleting all Figure children) and creates a new Axes in the default position. This syntax does not return a handle, so it is an error to specify a return argument. (This behavior is implemented by setting the Figure's NextPlot property to replace.)
Examples
To plot income in the top half of a Figure and outgo in the bottom half,
income = [3.2 4.1 5.0 5.6];
outgo = [2.5 4.0 3.35 4.9];
subplot(2,1,1); plot(income)
subplot(2,1,2); plot(outgo)
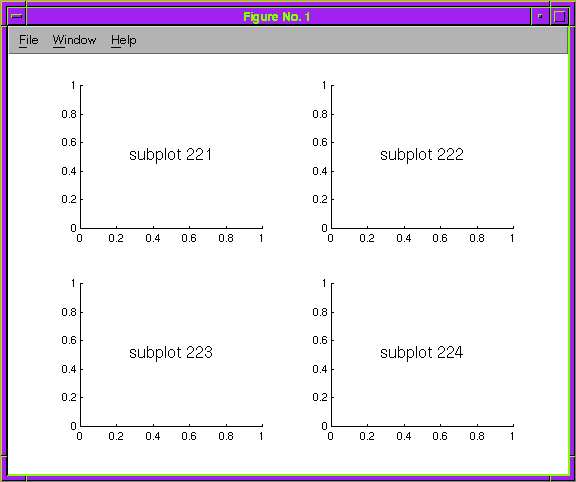
The following illustration shows four subplot regions and indicates the command used to create each:

See Also
axes, cla, clf, figure, gca
[ Previous | Help Desk | Next ]
